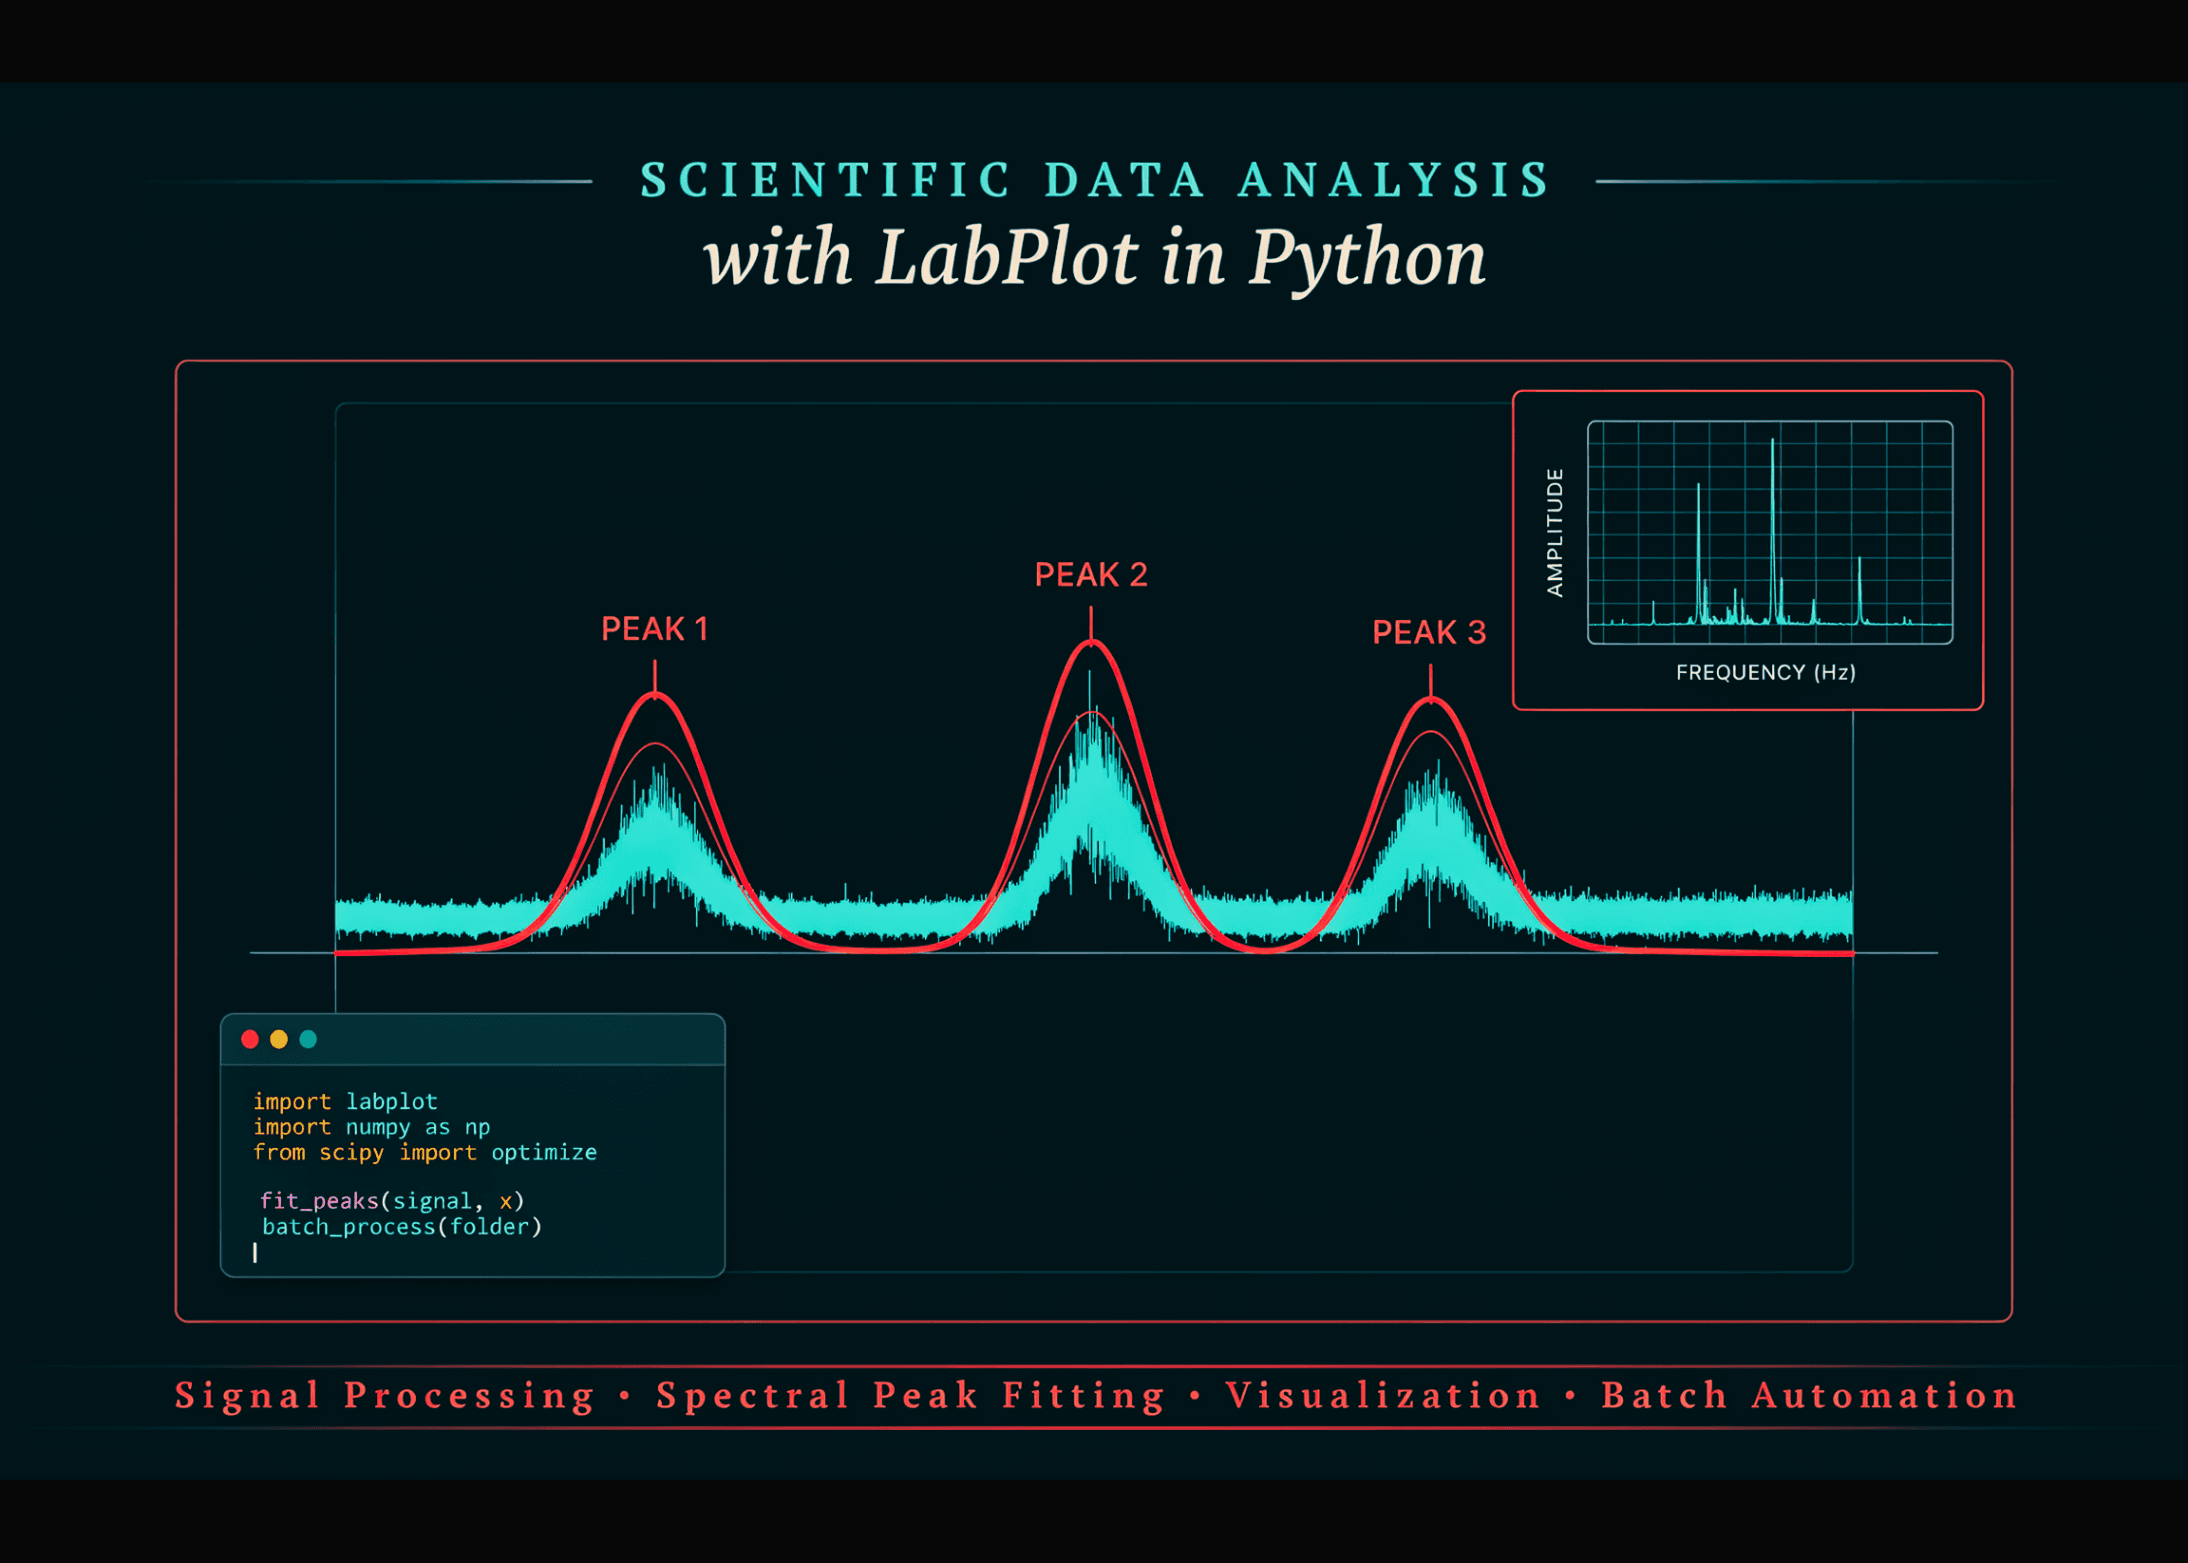
The tutorial reconstructs LabPlot’s core data model in pure Python, defining an aspect‑tree hierarchy (Project → Spreadsheet → Column) together with enumerations for plot designations and column modes. Analysis kernels are implemented as static‑method classes that wrap NumPy, SciPy and custom routines for smoothing (Savitzky‑Golay), differentiation, integration (trapezoid/Simpson), Fourier transform with windowing, ideal/Butterworth filtering, Hilbert transform, Douglas‑Peucker reduction, peak detection, and nonlinear least‑squares fitting (Levenberg‑Marquardt via scipy.optimize.least_squares). Each kernel returns structured results that feed directly into plotting objects (XYCurve, Histogram, CartesianPlot) which can be themed and exported to PDF, SVG or PNG. Project serialization mirrors LabPlot’s .lml format, supporting gzip, bzip2 and xz compression, and round‑trip integrity is verified by XML reconstruction. A batch‑processing example demonstrates automated peak���area extraction across temperature‑dependent spectra and a secondary exponential fit to reveal trends.
Key technical components:
- Aspect‑tree classes (
AbstractAspect,Column,Spreadsheet,Project) - Analysis modules (
nsl_smooth,nsl_dft,nsl_filter,nsl_peak,nsl_fit) - Plotting primitives (
XYCurve,Histogram,CartesianPlot,Worksheet) with theme support (BlackOnWhite, Dracula, SolarizedDark) - File I/O (
AsciiFilterfor delimited import,ProjectFilefor compressed .lml load/save) - Fit statistics suite (parameter uncertainties, confidence bands, goodness‑of‑fit metrics, AIC/BIC, residual diagnostics)
Why this matters
The implementation provides a transparent, extensible scaffold for reproducing LabPlot‑style workflows in a scriptable environment, enabling researchers to version‑control analysis pipelines, integrate them with broader Python ecosystems (NumPy, pandas, SciPy, matplotlib), and automate batch processing without relying on the GUI. By exposing the same analysis kernels and project model used by LabPlot, the approach lowers the barrier for reproducible scientific computing while preserving the familiar terminology and data structures that domain experts expect. This bridges the gap between interactive desktop tools and fully programmable, CI‑friendly research workflows.
Share this article
Found this insightful? Share it with your community on Reddit, X, or copy the link.